I’m a coffee guy! A black-coffee, no-milk no-sugar, kick-you-in-the-face coffee guy. There’s something about the taste of black coffee that I don’t want diluted with milk n sugar. That strong, bitter taste is like rocket fuel to start the day.
Rocket Fuel
In my last post, I showed you how saving $5 on coffee could save me $10,000 at 35. There was a rough list of coffee prices there, and I thought I would get a little more specific and list down the prices for my usual coffee spots for comparison!
I’m hoping to get more accurate figures to budget my life better. I hope this helps you too!
Let’s start with my favourite – cold coffee!
Note: Coffee bean only has one cold brew size compared to Starbucks’ three.
ALSO, you can see that the maximum savings you can get is $5.50 a day on cold, black (heartless, soulless) coffee. According to my calculator (download it here!) that would save me $15,467 at 35!
$15,467 saved! I should probably standardize the website tags…
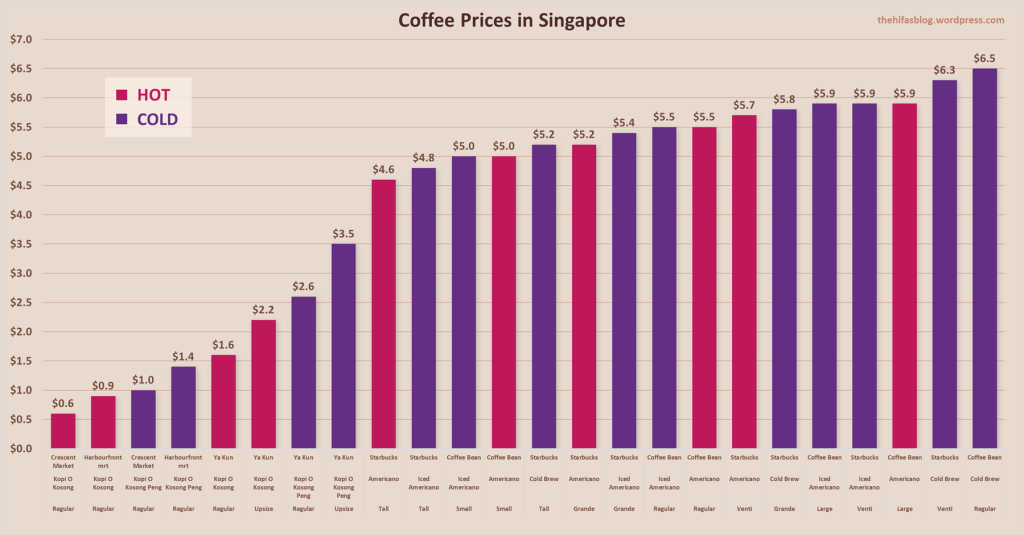
I thought it would also be interesting to list the prices for hot black coffee, which would eventually show us the price of ice after a quick subtraction.
The most you could save here is a comparable $5.3! Of course, given the difference in coffee quantity between Coffee Bean’s Large cup and a bag of kopi o kosong from your nearest hawker centre, you might have to drink a little less coffee a day to make those savings.. if you’re a big coffee drinker!
Thought it would help to compile em all in a big graph too:
Boomz
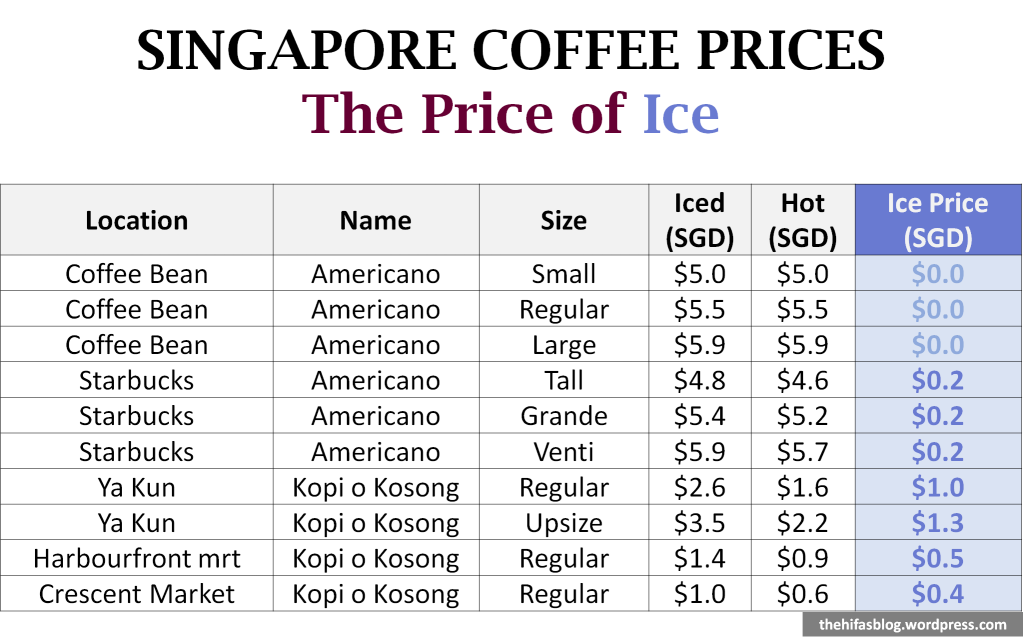
Aaaand ice price!
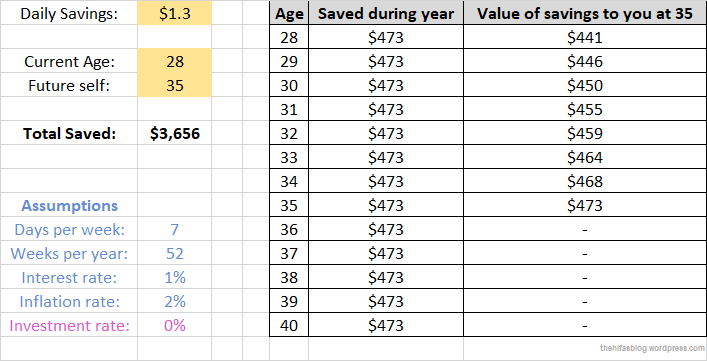
Interesting to see the increase in markup on ice for smaller vendors. That extra 20c-$1.30 would amount to an extra $562 – $3,656 for me at 35.
Jeng jeng jeng
Did you find the tables and charts useful? I’ll be adding more coffee prices here as I see them, and the next topic will be on something close to heart… cookies.
Living a short walk from the local shopping mall and hawker centre, my mornings could involve a kopi o kosong peng or an iced americano. Sometimes I french press some beans at at home, so it’s a real trilemma. To seek variety is human.
How much would these cups cost me?
Kopi O Kosong Peng: $1.40
Kopi O Kosong Peng (Local Branch 😉): $3.00
Iced Americano: $5.00
Cold Brew: $5.80
French Press at Home: $2.00 (depends on your beans; I use about 35g per cup so a 250g bag costing $14 = seven $1.96 cups)
Looking at the vast difference between café coffee and your local auntie’s finest, I could be saving $3.60 a day!
What would this mean in a year? Or 5 years?
Thanks to interest rates, inflation and options to invest, the answer is complex.
Luckily for you,
My kung fu strong.
So before we get into the sheet [free download at the end of this post!] there are some basics to unpack.
Interest Rates
To someone saving their money, interest rates are the amount your saved money grows over time, or the amount that banks pay you to keep your money in their account, which they would then use to lend borrowers and charge them that interest.
Moneysmart’s already compiled a nice, updated list of Singapore interest rates to refer to, but for the sake of this post I’ll assume a value of 1%. This means my saved money today would grow by 1%per annum over the years.
Inflation Rates
Eroder of savings. Eater of worlds. Inflation is probably the number 1 reason to invest your money, and also why my iced kopi costs $1.40 instead of $0.90 like it used to.
Inflation rates measure the rate of increase of prices of stuff (goods and services la) over time. Inflation has many causes – higher costs stuff-production, higher wages of stuff-makers (shame on your payraise), higher demand for stuff (e.g. when people in developing citiers can afford higher standards of living) and government policies are the usual suspects.
To choose an inflation rate, there are a few options. In Singapore, most sources use the Consumer Price Index (CPI) to measure our inflation rate. The CPI tracks the change in price of commonly purchased goods and services, including housing and transportation. For this post, however, I’ll be using the MAS Core Inflation for a more generalised value excluding fluctuations in housing and transport. More info here!
Source: mti.gov.sg
I’ll be assuming a fixed inflation rate of 2% per annum.
Investment
Hello popular topic! Getting into the various options for investment and assumptions of investment growth rates can bloat up a post real quick. However, it’ll be good to illustrate just what can happen without investment, so I’m going to assume an investment growth rate of 0%. Ho ho. He he.
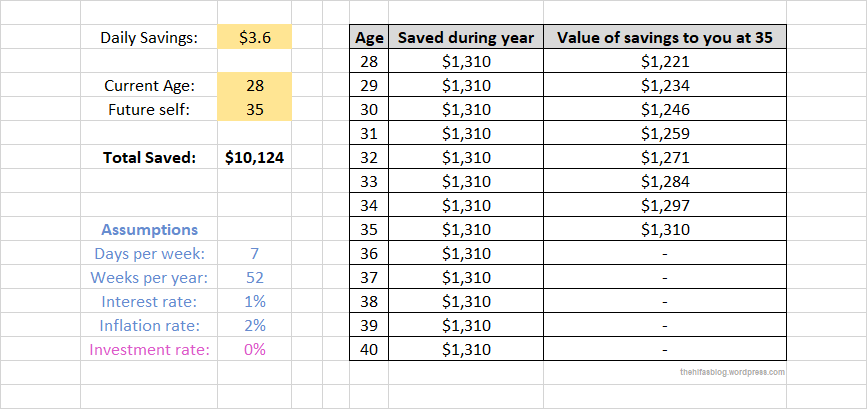
Daily Savings: Iced Americano ($5.00) to Kopi O Kosong peng ($1.40) = $3.60
So saving $3.60 a day on coffee earns me $1,310 a year! That may not look like much, and as you can see from the rightmost column, $1,310 saved in the bank (earning interest) in 2020 will only have the spending power of $1,221 after I reach 35 in 2027 (technically I’ll be 36 in September 2027, but you get the point).
and that’s inflation! With our assumed rate of 2%, that would mean that my $1.40 kopi o kosong peng today would cost me $1.60 in 2027.
Summing up the accumulated years of savings, 7 years of disciplined cheap coffee drinking would result in an extra $10,124in my bank account.
How much would I have if I invested the savings I made in, say, those CPF top-ups with a guaranteed rate of 4%? (I mean there are a ton of other options but baby steps please)
$1,310 saved this year would no longer be worth less next year, but more. Specifically, the growth percentage would look like this:
I’m a project engineer and we do late nights sometimes!
While I’m not a cab guy (Public Transport is a no-brainer here!) (If you’re childless) (And don’t work in Jurong Island), the chains of late nights have a glorious hidden benefit – racking up them Grab Rewards perks. (Not sponsored [by anyone!], chill.)
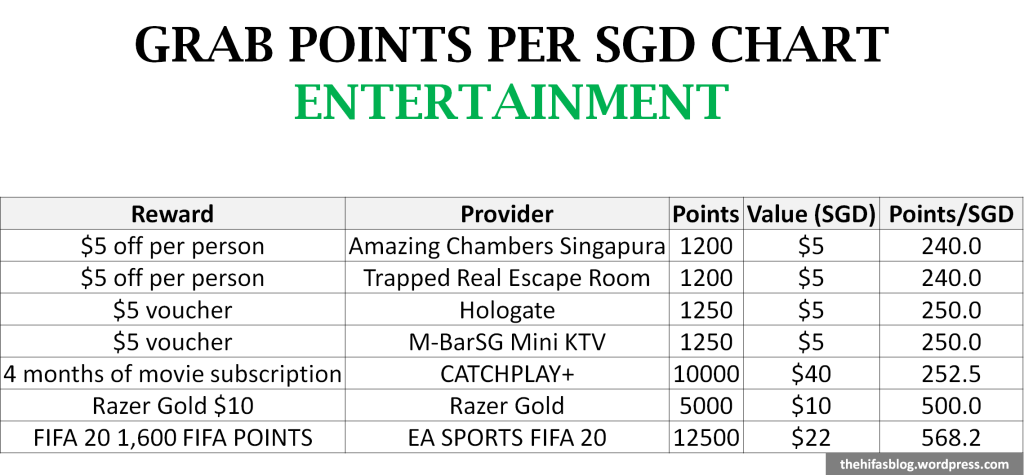
I’ll get right to it: I sheeted all rewards I could see on my app, added their equivalent value and calculated the points/SGD for each one.
What the points/SGD column means: Lower is better. It means you can use up fewer points to get back a dollar.
The categories listed on the app are Entertainment, F&B, Grab, Limited Edition, Services, Travel and Shopping. Here goes:
Wait, isn’t that food? – Grab categorises these under Travel because you can only redeem them at the Changi Airport T3 transit lounge!
So which one is the ‘most‘ worth it?
Sorry: There’s no clear answer! Technically, for the % off-discount-type rewards, the amount of SGD you save is endless because it scaled with the total amount you spend. Also, with rewards like Yogofi’s unlimited monthly wifi, I maxed out the value by putting in the most expensive daily plan ($12.90/day for Middle East, Egypt, Reunion, South Africa), so important disclaimer – your mileage may vary!
Did I miss anything? Let me know what you think (comments section below).
So I invest in various stocks from time to time. (I started off with the SAXO Trader platform, which has been convenient so far) I am not sponsored by anyone, calm your tatas.
In the wake of the recent downturn, it’s become my habit to check out how the US stocks are doing every night at 9.30pm when the NASDAQ/NYSE opens. Buy low, they say, and we’re all waiting for the bottom of dat dip.
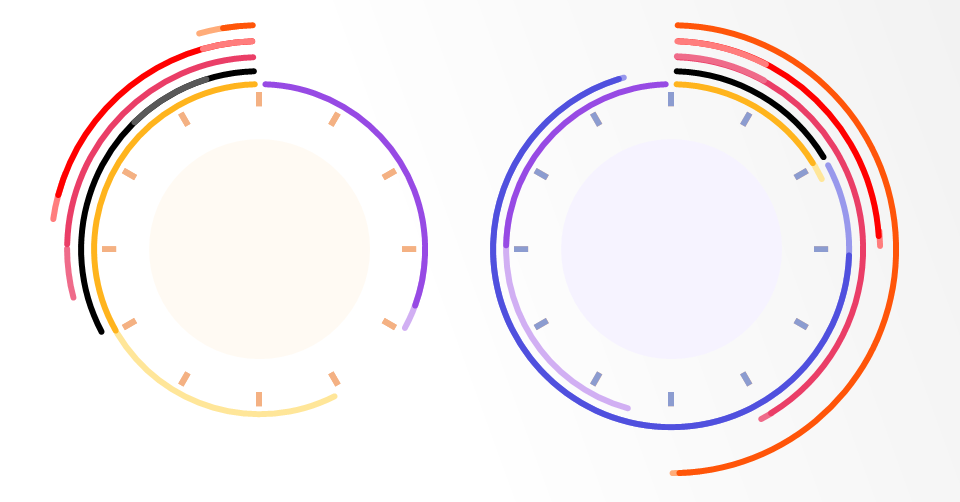
As I track a few international equities, I’ve tried to get a clear grip on when each market opens in SG time (GMT +8). The list on tradinghours.com was a helpful reference.
I thought it would be useful to track the timings in a single graphic:
Explanatory note: Pre-Open/Pre-Closing Hours are excluded! For those who want the details, here is the full table for you:
I also thought it would be cool to make a 24-hour clock to summarise the trading hour timings all in one graphic:
Next Steps:
The clock is currently purely for the SG time zone (GMT+8). It should be pretty simple to make it easy for my source files to display relevant clock/clocks and tables for other time zones.
A brief explanation of Daylight Savings time!
I hope you like them.
Anything I missed out? Any parts I can explain? Or improve? Let me know what you think in the comments please!


